Trend & History
Stronger Decisions Through Trend and Historical Data Analysis
The Trend & History module analyzes changes in industrial data over time, providing clear visibility into trends and historical performance. It enables early detection of deviations in operational processes.
By leveraging historical data and trend insights, performance evaluation, comparison, and optimization become faster and more accurate.
Get Demo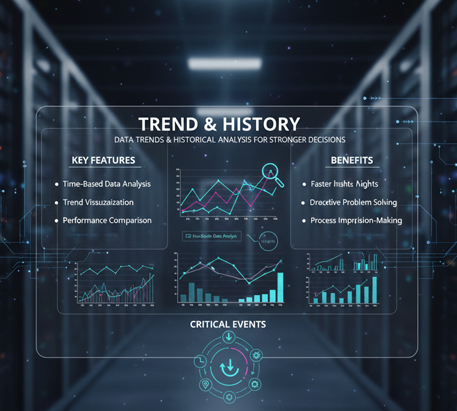
The problem
Limited insights from historical data analysis
Late detection of performance changes and anomalies
Lack of data-driven insights in decision-making processes
Solution
Detailed trend analysis based on time-series data
Visualization and comparison of historical performance
Reliable and actionable insights for operational decisions
Highlights
Technical Architecture
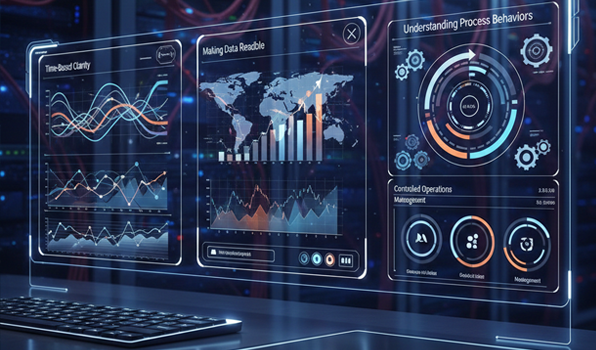
Making Data Readable
It presents complex data with understandable graphs and trends.
Understanding Process Behaviours
It clearly reveals how systems behave over time.
Controlled Operation Management
Ensures that the processes are kept under control by following the changes.
Security & Management
Frequently Asked Questions
What does the Trend & History module do?
It analyses the evolution of data over time, making trends, past performance and deviations visible.
Which types of data can be analysed?
All operational and measurement data with time series logic can be analysed.
In which periods are trend analyses performed?
Hourly, daily, weekly, weekly, monthly or customised time intervals can be defined.
Can a comparison be made with past data?
Yes, comparative analysis is possible. Comparative analysis can be made between different periods, shifts or time intervals.
How does deviation detection work?
Data that fall outside the specified normal value ranges are automatically detected.
How does it contribute to decision-making processes?
Supports more consistent and data-driven decision-making by showing long-term trends and performance changes.
Does it offer reporting and visualisation?
Yes, it is possible. Trends and historical data can be presented with graphs and summary views.
Related Content

AI Analytics
3 min reading
The New Era of Industrial Operations with AI Chatbots
AI chatbots are redefining how industrial companies manage information, make decisions, and communicate…
Read more
Energy
3 min reading
How a Renewable Energy Data Platform Transformed Power Plant Operations
A modern renewable energy data platform is essential for companies operating multiple hydro, wind, solar,…
Read more
Cement
3 min reading
How the OSDU Data Platform Is Transforming Energy Digitalization
The OSDU Data Platform is becoming one of the most critical technologies shaping the future of energy…
Read more